ELF's Linker's and other magical creatures
One of the popular topics on many engineering blogs is program startup and ELF file structure. Given that fact, a reader may have some objections about whether another post about ELF makes sense or not. Besides that, I decided to attack this topic from the different angle. There are two reasons beyond that decision: first of all is a really interesting topic, but more importantly, this material will be useful in the future (without spoiling why).
Running environment
Examples below can be run on most of the UNIX based systems, however, I will stick with Linux as out of the box most of the distributions come with the newest versions of the tools used to analyze binaries.
Useful Tools
In this article which covers elf format and linker behavior we will use the following tools:
objdump
Object dump (objdump) is a simple and clean solution for a quick disassembly of code. It is great for disassembling simple and untampered binaries but will show its limitations quickly when attempting to use it for any real challenging reverse engineering tasks, especially against hostile software. Its primary weakness is that it relies on the ELF section headers and doesn’t perform control flow analysis, which are both limitations that greatly reduce its robustness. This results in not being able to correctly disassemble the code within a binary, or even open the binary at all if there are no section headers. For many conventional tasks, however, it should suffice, such as when disassembling common binaries that are not fortified, stripped, or obfuscated in any way. It can read all common ELF types. Here are some common examples of how to use objdump you can check objdump man pages:
# View all data/code in every section of an ELF file:
objdump -D <elf_obj>
# View only program code in an ELF file:
objdump -d <elf_obj>
# View all symbols:
objdump -tT <elf_obj>
readelf
The readelf command is one of the most useful tools around for dissecting ELF binaries. It provides every bit of the data specific to ELF necessary for gathering information about an object before reverse engineering it. This tool will be used often throughout the book to gather information about symbols, segments, sections, relocation entries, dynamic linking of data, and more. The readelf command is the Swiss Army knife of ELF, but usually not really helpful for other binary formats (In contrast to objdump). Below are a few examples of its most commonly used cases: readelf man pages
# To retrieve a section header table:
readelf -S <elf_obj>
# To retrieve a program header table:
readelf -l <elf_obj>
# To retrieve a symbol table:
readelf -s <elf_obj>
# To retrieve the ELF file header data:
readelf -e <elf_obj>
# To retrieve relocation entries:
readelf -r <elf_obj>
# To retrieve a dynamic segment:
readelf -d <elf_obj>
nm
One of the members of the binutils package to work with the executable format is nm. Is the simplest tool from this list nm lists file symbols. Few examples of the usage below: nm man pages
# View Dynamic Symbols in an Executable
nm -D <elf_obj>
# View the External Symbols of an Executable
nm -g <elf_obj>
# View all symbols including debug symbols
nm -a <elf_obj>
# View both value and size of defined symbols
nm -S <elf_obj>
gdb
GNU Debugger (GDB) is not only good to debug buggy applications, but is an essential tool for hackers and can be used in various situations like learning about a program’s control flow, change a program’s control flow, and modify the code, registers, and data structures. These tasks are common for hackers, reverse engineers or system engineers. GDB works on ELF binaries, Linux processes or even application/kernel core dumps. gdb man pages
Man pages are quite long as these tools are coming with a lot of useful options, and there is no good reason, in my opinion, to try to read all of them But instead is really good to coming back to them and search for interesting options or clarifying existing commands.
Explore binary files
First of all, we will write simple C program and try to use some of the commonly known tools to understand it structure after compilation to object and linked executable file.
Sample program made from two source code files and header in C:
//file: main.c
#include <stdio.h>
int main()
{
        int user_input;

        printf( "Enter a value :");
        scanf("%d", &user_input);

        show_smaller(user_input);

        return 0;
}
//file source.c
#include <stdio.h>
void show_smaller(int val)
{
for (int i=val; i>=0; --i)
printf( "\n%d", i);
return;
}Now compile the source codes. First we can just create binary object by compiling with -c flag
# create objects main.o, source.o no linker involved
gcc -c main.c source.c
First tool that we can use to browse symbols inside a binary object in nm.
nm  ./main.o
                 U __isoc99_scanf
0000000000000000 T main
                 U printf
                 U show_smaller
                 U __stack_chk_fail
We see few symbols: main function, show_smaller, printf, scanf and _stack_chk_fail.
The nm does not know anything about other symbols than main. We as an author of the source code know that we want to use custom show_smaller function and will be using printf, scanf from the standard library, also we got as a bonus from GCC security feature: stack protector which bring additional symbol __stack_chk_fail. We can get rid of it by using compilation flag no-stack-protector (gcc -c ./main.c -fno-stack-protector )
nm print results in columns: the first column is an address of the symbol, the second show symbol type, and the last column show the name of the symbol.
In the example we have just two types of the symbols: T and U. From nm man pages we can find a description of these letters:
“U” - The symbol is undefined.
“T” - The symbol is in the text (code) section.
Which should be logical, as at this point the only function that was written by us in the main object is function main
We also used other functions some of which are from external libraries and show_smaller which we defined inside source.c.
Running nm on the source.o object should not be surprising in any way.
nm ./source.o
                 U printf
0000000000000000 T show_smaller
Now we will take a look how binary object refers to external functions. To extract more information from a binary file we can use objdump. As a first step, print code section with assembly instruction:
objdump -S main.o

main.o:     file format elf64-x86-64

Disassembly of section .text:

0000000000000000 <main>:
   0:   55                      push   %rbp
   1:   48 89 e5                mov    %rsp,%rbp
   4:   48 83 ec 10             sub    $0x10,%rsp
   8:   64 48 8b 04 25 28 00    mov    %fs:0x28,%rax
   f:   00 00
  11:   48 89 45 f8             mov    %rax,-0x8(%rbp)
  15:   31 c0                   xor    %eax,%eax
  17:   bf 00 00 00 00          mov    $0x0,%edi
  1c:   b8 00 00 00 00          mov    $0x0,%eax
  21:   e8 00 00 00 00          callq  26 <main+0x26>
  26:   48 8d 45 f4             lea    -0xc(%rbp),%rax
  2a:   48 89 c6                mov    %rax,%rsi
  2d:   bf 00 00 00 00          mov    $0x0,%edi
  32:   b8 00 00 00 00          mov    $0x0,%eax
  37:   e8 00 00 00 00          callq  3c <main+0x3c>
  3c:   8b 45 f4                mov    -0xc(%rbp),%eax
  3f:   89 c7                   mov    %eax,%edi
  41:   e8 00 00 00 00          callq  46 <main+0x46>
  46:   b8 00 00 00 00          mov    $0x0,%eax
  4b:   48 8b 55 f8             mov    -0x8(%rbp),%rdx
  4f:   64 48 33 14 25 28 00    xor    %fs:0x28,%rdx
  56:   00 00
  58:   74 05                   je     5f <main+0x5f>
  5a:   e8 00 00 00 00          callq  5f <main+0x5f>
  5f:   c9                      leaveq
  60:   c3                      retq
A few callq instructions with target address: e8 00 00 00 00. We know that e8 is optcode of callq instruction (we can trust objdump tool or check it by ourselves in Intel optcodes online arch) and rest of the space (4 bytes) is a placeholder to be filled later.
A curious reader may ask: why as an output of 64-bytecode we got only 4 bytes for the address?
That is caused by gcc default behavior, it tries to fit whole code in 32 bits addressing model or in other words using relative addressing mode which is considered as a faster because of the internals of relative jump.
The reader interested in code models can recompile main.c with -mcmodel=large and -mcmodel=medium and then compare output of objdump -S.
**-mcmodel=small**
    Generate code for the small code model. The program and its statically defined symbols must be within 4GB of each other. Programs can be statically or dynamically linked. This is the default code model.
Informations about external symbols aren’t in code section. Next step will be to see headers, we can do this with -x option:
objdump -x ./main.o

./main.o:     file format elf64-x86-64
./main.o
architecture: i386:x86-64, flags 0x00000011:
HAS_RELOC, HAS_SYMS
start address 0x0000000000000000

Sections:
Idx Name          Size      VMA               LMA               File off  Algn
  0 .text         0000003e  0000000000000000  0000000000000000  00000040  2**0
                  CONTENTS, ALLOC, LOAD, RELOC, READONLY, CODE
  1 .data         00000000  0000000000000000  0000000000000000  0000007e  2**0
                  CONTENTS, ALLOC, LOAD, DATA
  2 .bss          00000000  0000000000000000  0000000000000000  0000007e  2**0
                  ALLOC
  3 .rodata       00000013  0000000000000000  0000000000000000  0000007e  2**0
                  CONTENTS, ALLOC, LOAD, READONLY, DATA
  4 .comment      00000036  0000000000000000  0000000000000000  00000091  2**0
                  CONTENTS, READONLY
  5 .note.GNU-stack 00000000  0000000000000000  0000000000000000  000000c7  2**0
                  CONTENTS, READONLY
  6 .eh_frame     00000038  0000000000000000  0000000000000000  000000c8  2**3
                  CONTENTS, ALLOC, LOAD, RELOC, READONLY, DATA
SYMBOL TABLE:
0000000000000000 l    df *ABS*  0000000000000000 main.c
0000000000000000 l    d  .text  0000000000000000 .text
0000000000000000 l    d  .data  0000000000000000 .data
0000000000000000 l    d  .bss   0000000000000000 .bss
0000000000000000 l    d  .rodata        0000000000000000 .rodata
0000000000000000 l    d  .note.GNU-stack        0000000000000000 .note.GNU-stack
0000000000000000 l    d  .eh_frame      0000000000000000 .eh_frame
0000000000000000 l    d  .comment       0000000000000000 .comment
0000000000000000 g     F .text  000000000000003e main
0000000000000000         *UND*  0000000000000000 printf
0000000000000000         *UND*  0000000000000000 __isoc99_scanf
0000000000000000         *UND*  0000000000000000 show_smaller

RELOCATION RECORDS FOR [.text]:
OFFSET           TYPE              VALUE
0000000000000009 R_X86_64_32       .rodata
0000000000000013 R_X86_64_PC32     printf-0x0000000000000004
000000000000001f R_X86_64_32       .rodata+0x0000000000000010
0000000000000029 R_X86_64_PC32     __isoc99_scanf-0x0000000000000004
0000000000000033 R_X86_64_PC32     show_smaller-0x0000000000000004

RELOCATION RECORDS FOR [.eh_frame]:
OFFSET           TYPE              VALUE
0000000000000020 R_X86_64_PC32     .text
Objdump showed a symbol table with relocations and names of the functions. I already introduced here term relocations so, before we will move forward I need to explain what these relocations are.
Relocations
blockquote From the ELF(5) man pages Relocation is the process of connecting symbolic references with symbolic definitions. Relocatable files must have information that describes how to modify their section contents, thus allowing executable and shared object files to hold the right information for a process’s program image. Relocation entries are these data.
To understand better what relocations are, we can print them from main.o compiled with default gcc options and also with option mcmodel=large:
# Print relocations from default build object:

objdump  -r -d ./main.o

./main.o:     file format elf64-x86-64

Disassembly of section .text:

0000000000000000 <main>:
   0:   55                      push   %rbp
   1:   48 89 e5                mov    %rsp,%rbp
   4:   48 83 ec 10             sub    $0x10,%rsp
   8:   bf 00 00 00 00          mov    $0x0,%edi
                        9: R_X86_64_32  .rodata
   d:   b8 00 00 00 00          mov    $0x0,%eax
  12:   e8 00 00 00 00          callq  17 <main+0x17>
                        13: R_X86_64_PC32       printf-0x4
  17:   48 8d 45 fc             lea    -0x4(%rbp),%rax
  1b:   48 89 c6                mov    %rax,%rsi
  1e:   bf 00 00 00 00          mov    $0x0,%edi
                        1f: R_X86_64_32 .rodata+0x10
  23:   b8 00 00 00 00          mov    $0x0,%eax
  28:   e8 00 00 00 00          callq  2d <main+0x2d>
                        29: R_X86_64_PC32       __isoc99_scanf-0x4
  2d:   8b 45 fc                mov    -0x4(%rbp),%eax
  30:   89 c7                   mov    %eax,%edi
  32:   e8 00 00 00 00          callq  37 <main+0x37>
                        33: R_X86_64_PC32       show_smaller-0x4
  37:   b8 00 00 00 00          mov    $0x0,%eax
  3c:   c9                      leaveq
  3d:   c3                      retq


# Print relocations from build with -mcmodel=large option
objdump  -r -d ./main.o

./main.o:     file format elf64-x86-64

Disassembly of section .text:

0000000000000000 <main>:
   0:   55                      push   %rbp
   1:   48 89 e5                mov    %rsp,%rbp
   4:   48 83 ec 10             sub    $0x10,%rsp
   8:   48 bf 00 00 00 00 00    movabs $0x0,%rdi
   f:   00 00 00
                        a: R_X86_64_64  .rodata
  12:   b8 00 00 00 00          mov    $0x0,%eax
  17:   48 ba 00 00 00 00 00    movabs $0x0,%rdx
  1e:   00 00 00
                        19: R_X86_64_64 printf
  21:   ff d2                   callq  *%rdx
  23:   48 8d 45 fc             lea    -0x4(%rbp),%rax
  27:   48 89 c6                mov    %rax,%rsi
  2a:   48 bf 00 00 00 00 00    movabs $0x0,%rdi
  31:   00 00 00
                        2c: R_X86_64_64 .rodata+0x10
  34:   b8 00 00 00 00          mov    $0x0,%eax
  39:   48 ba 00 00 00 00 00    movabs $0x0,%rdx
  40:   00 00 00
                        3b: R_X86_64_64 __isoc99_scanf
  43:   ff d2                   callq  *%rdx
  45:   8b 45 fc                mov    -0x4(%rbp),%eax
  48:   89 c7                   mov    %eax,%edi
  4a:   48 b8 00 00 00 00 00    movabs $0x0,%rax
  51:   00 00 00
                        4c: R_X86_64_64 show_smaller
  54:   ff d0                   callq  *%rax
  56:   b8 00 00 00 00          mov    $0x0,%eax
  5b:   c9                      leaveq
  5c:   c3                      retq
What we can see: Relocations are in machine-dependent types. In the first example, we have 64-bit addresses but relocations are 32-bit relative offsets, the second example show us 64-bit relocation that is symbol address placed to the registers. Now we will move from standalone object files and take a look at the linked ELF file. First, need to compile and then again we will take a look at the main function, and how it changed.
# create executable test from sources main.c and source.c system linker used
gcc -o test main.c source.c
objdump -S test | grep -A 25 "<main>"
00000000004005f6 <main>:
4005f6: 55 push %rbp
4005f7: 48 89 e5 mov %rsp,%rbp
4005fa: 48 83 ec 10 sub $0x10,%rsp
4005fe: 64 48 8b 04 25 28 00 mov %fs:0x28,%rax
400605: 00 00
400607: 48 89 45 f8 mov %rax,-0x8(%rbp)
40060b: 31 c0 xor %eax,%eax
40060d: bf 14 07 40 00 mov $0x400714,%edi
400612: b8 00 00 00 00 mov $0x0,%eax
400617: e8 a4 fe ff ff callq 4004c0 <printf@plt>
40061c: 48 8d 45 f4 lea -0xc(%rbp),%rax
400620: 48 89 c6 mov %rax,%rsi
400623: bf 24 07 40 00 mov $0x400724,%edi
400628: b8 00 00 00 00 mov $0x0,%eax
40062d: e8 ae fe ff ff callq 4004e0 <__isoc99_scanf@plt>
400632: 8b 45 f4 mov -0xc(%rbp),%eax
400635: 89 c7 mov %eax,%edi
400637: e8 1b 00 00 00 callq 400657 <show_smaller>
40063c: b8 00 00 00 00 mov $0x0,%eax
400641: 48 8b 55 f8 mov -0x8(%rbp),%rdx
400645: 64 48 33 14 25 28 00 xor %fs:0x28,%rdx
40064c: 00 00
40064e: 74 05 je 400655 <main+0x5f>
400650: e8 5b fe ff ff callq 4004b0 <__stack_chk_fail@plt>
400655: c9 leaveq
0000000000400657 <show_smaller>:
400657: 55 push %rbp
400658: 48 89 e5 mov %rsp,%rbp
40065b: 48 83 ec 20 sub $0x20,%rsp
40065f: 89 7d ec mov %edi,-0x14(%rbp)
400662: 8b 45 ec mov -0x14(%rbp),%eaxHow relocations based on relative address are done in practice:
Going back to the assembly instruction where show_smaller function is called:
e8 1b 00 00 00 callq 400657 <show_smaller> callq = e8
Objdump show us show_smaller on the address: 0x400657, callq show_smaller is 0x400657 and 0x1b is offset created by linker, if we add everything together we discovered that is 5 bytes left.
0x400657 - (0x400637 + 0x1b) = 0x5
So 0x400637 is address of callq <show_smaller> but in this line we do have 5 bytes e8 1b 00 00 00 so to get address of relocation show_smaller we need to add these 5 and we got the answer 0x400657 <show_smaller>
Relocations aren’t only code functions, as we saw before also printf argument which is a string constant is resolved as relocation 0060d: bf 14 07 40 00 mov $0x400714,%edi
We can take a look at content inside this address in section rodata:
objdump -s -j .rodata ./test
./test:     file format elf64-x86-64

Contents of section .rodata:
 400710 01000200 456e7465 72206120 76616c75  ....Enter a valu
 400720 65203a00 2564000a 256400             e :.%d..%d.
Now we just confirmed that at address 0x400714 is letter “E”, first from the "Enter a value" string.
Elf file structure
ELF file types
An ELF file may be marked as one of the following types:
• ET_NONE: This is an unknown type, indicates that the file type is unknown, or has not yet been defined.
• ET_REL: This is a relocatable file. ELF type relocatable means that the file is marked as a relocatable piece of code or sometimes called an object file. Relocatable object files are generally pieces of Position-independent code (PIC) that have not yet been linked into an executable. You will often see *.o files in a compiled code base. These are the files that hold code and data suitable for creating an executable file.
• ET_EXEC: This is an executable file. ELF type executable means that the file is marked as an executable file. These types of files are also called programs and are the entry point of how a process begins running.
• ET_DYN: This is a shared object. ELF type dynamic means that the file is marked as a dynamically linkable object file, also known as shared libraries. These shared libraries are loaded and linked into a program’s process image at runtime.
• ET_CORE: This is an ELF type core that marks a core file. A core file is a dump of a full process image during the time of a program crash or when the process has delivered a SIGSEGV signal (segmentation violation). By using GDB we can read these files and understand why the crash happened.
Headers and identification of architecture
The most basic information that is needed at the very beginning of the loading program is target architecture. ELF file contains headers that describe segments within a binary and are necessary for program loading. OS kernel understands segments during load time and describes the memory layout of an executable on disk and how it should translate to memory. The program header table can be accessed by referencing the offset found in the initial ELF header member called e_phoff (program header table offset).
/* The ELF header is described by the type Elf32_Ehdr or Elf64_Ehdr inside <elf.h> */

    #define EI_NIDENT 16

    typedef struct {
        unsigned char e_ident[EI_NIDENT];
        uint16_t      e_type;
        uint16_t      e_machine;
        uint32_t      e_version;
        ElfN_Addr     e_entry;
        ElfN_Off      e_phoff;
        ElfN_Off      e_shoff;
        uint32_t      e_flags;
        uint16_t      e_ehsize;
        uint16_t      e_phentsize;
        uint16_t      e_phnum;
        uint16_t      e_shentsize;
        uint16_t      e_shnum;
        uint16_t      e_shstrndx;
    } ElfN_Ehdr;
Using tool file we can read ELF headers:
file test
test: ELF 64-bit LSB executable, x86-64, version 1 (SYSV), dynamically linked, interpreter /lib64/ld-linux-x86-64.so.2, for GNU/Linux 2.6.32, BuildID[sha1]=602d8b1507f38ea77582299911e93b72e840b282, not stripped
Segments
Executable code or program data are stored inside parts of the ELF file called segments. Borders of these regions and their size are defined inside the program file header. Each segment is described by structure Elf32_Phdr or Elf64_Phdr and they are arranged in a continuous manner. A number of segments are defined in e_phnum field of ElfN_Ehdr structure.
The most important segments
PT_INTERP: Describe the full path to the dynamic linkerld.so. The segments point to the region with the path by fieldp_offsetPT_LOAD: Describe the region that will be placed into the program memory. Data fromp_offsetwill be copied into thep_vaddrPT_DYNAMIC: Contain information for loader required to load the ELF. An executable will always have at least onePT_LOADtype segment.
    typedef struct {
        uint32_t   p_type;
        Elf32_Off  p_offset;
        Elf32_Addr p_vaddr;
        Elf32_Addr p_paddr;
        uint32_t   p_filesz;
        uint32_t   p_memsz;
        uint32_t   p_flags;
        uint32_t   p_align;
    } Elf32_Phdr;

    typedef struct {
        uint32_t   p_type;
        uint32_t   p_flags;
        Elf64_Off  p_offset;
        Elf64_Addr p_vaddr;
        Elf64_Addr p_paddr;
        uint64_t   p_filesz;
        uint64_t   p_memsz;
        uint64_t   p_align;
    } Elf64_Phdr;
Segment PT_LOAD
Usually executable files contains two PT_LOAD segments, first one describe data with machine code second one data used by the code. That is why we see two sections one RE and second one RW.
readelf -l ./test  | grep LOAD -A 1
  LOAD           0x0000000000000000 0x0000000000400000 0x0000000000400000
                 0x000000000000087c 0x000000000000087c  R E    200000
  LOAD           0x0000000000000e10 0x0000000000600e10 0x0000000000600e10
                 0x0000000000000238 0x0000000000000240  RW     200000
Segment PT_DYNAMIC
Each executable which is not build staticaly (*.so) contain section called .dynamic.
We can display dynamic linking arrayfrom previously compiled test program.
readelf -d ./test

Dynamic section at offset 0xe28 contains 24 entries:
  Tag        Type                         Name/Value
 0x0000000000000001 (NEEDED)             Shared library: [libc.so.6]
 0x000000000000000c (INIT)               0x400480
 0x000000000000000d (FINI)               0x400704
 0x0000000000000019 (INIT_ARRAY)         0x600e10
 0x000000000000001b (INIT_ARRAYSZ)       8 (bytes)
 0x000000000000001a (FINI_ARRAY)         0x600e18
 0x000000000000001c (FINI_ARRAYSZ)       8 (bytes)
 0x000000006ffffef5 (GNU_HASH)           0x400298
 0x0000000000000005 (STRTAB)             0x400348
 0x0000000000000006 (SYMTAB)             0x4002b8
 0x000000000000000a (STRSZ)              115 (bytes)
 0x000000000000000b (SYMENT)             24 (bytes)
 0x0000000000000015 (DEBUG)              0x0
 0x0000000000000003 (PLTGOT)             0x601000
 0x0000000000000002 (PLTRELSZ)           96 (bytes)
 0x0000000000000014 (PLTREL)             RELA
 0x0000000000000017 (JMPREL)             0x400420
 0x0000000000000007 (RELA)               0x400408
 0x0000000000000008 (RELASZ)             24 (bytes)
 0x0000000000000009 (RELAENT)            24 (bytes)
 0x000000006ffffffe (VERNEED)            0x4003c8
 0x000000006fffffff (VERNEEDNUM)         1
 0x000000006ffffff0 (VERSYM)             0x4003bc
 0x0000000000000000 (NULL)               0x0
ELF section headers
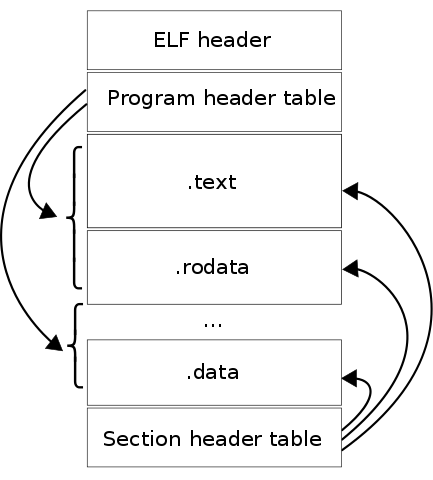
After we have looked at what program headers, it is time to take a look at section headers. I really want to point out here the distinction between the two. I often hear people calling sections, segments, and vice versa. Section is not a segment, segments are necessary for program execution, and within each segment, there is either code or data divided up into sections. We can recall here Wikipedia picture with a dual view of the ELF file runtime and binary file. A section header table exists to reference the location and size of these sections and is primarily for linking and debugging purposes. Section headers are not necessary for program execution, and a program will execute just fine without having a section header table. This is because the section header table doesn’t describe the program memory layout. That is the responsibility of the program header table. The section headers are really just complementary to the program headers.
typedef struct {
    uint32_t   sh_name;
    uint32_t   sh_type;
    uint64_t   sh_flags;
    Elf64_Addr sh_addr;
    Elf64_Off  sh_offset;
    uint64_t   sh_size;
    uint32_t   sh_link;
    uint32_t   sh_info;
    uint64_t   sh_addralign;
    uint64_t   sh_entsize;
} Elf64_Shdr;
Program in the memory
Linux comes with a virtual filesystem called procfs which usually is mounted at /proc. This filesystem provides a lot of useful options for process tracing and debugging.
Inside /proc folder we can find a lot of folders called with numbers. Each of these folders corresponds to the running process with unique pid.
By running our test process we can create a new entry.
./test
# and in another window
ps -e | grep test
25824 pts/11   00:00:00 test
So our running proces has pid = 25824, now we can see entries inside /proc/<pid>. We don’t have enought time to cover all entries
 ls /proc/25824/
attr        comm             fd        map_files   net            pagemap      schedstat  statm          uid_map
autogroup   coredump_filter  fdinfo    maps        ns             patch_state  sessionid  status         wchan
auxv        cpuset           gid_map   mem         numa_maps      personality  setgroups  syscall
cgroup      cwd              io        mountinfo   oom_adj        projid_map   smaps      task
clear_refs  environ          limits    mounts      oom_score      root         stack      timers
cmdline     exe              loginuid  mountstats  oom_score_adj  sched        stat       timerslack_ns
objdump -S /proc/25824/exe | grep main -A 25
00000000004005f6 <main>:
4005f6: 55 push %rbp
4005f7: 48 89 e5 mov %rsp,%rbp
4005fa: 48 83 ec 10 sub $0x10,%rsp
4005fe: 64 48 8b 04 25 28 00 mov %fs:0x28,%rax
400605: 00 00
400607: 48 89 45 f8 mov %rax,-0x8(%rbp)
40060b: 31 c0 xor %eax,%eax
40060d: bf 14 07 40 00 mov $0x400714,%edi
....
40064e: 74 05 je 400655 <main+0x5f>
400650: e8 5b fe ff ff callq 4004b0 <__stack_chk_fail@plt>
400655: c9 leaveq
400656: c3 retq
0000000000400657 <show_smaller>:Process Memory
File maps is a element of sysfs which contains informations about memory map of the given process. This information is available in nice readable format:
cat /proc/25824/maps
00400000-00401000 r-xp 00000000 08:01 4097                               /root/tests/blog/test
00600000-00601000 r--p 00000000 08:01 4097                               /root/tests/blog/test
00601000-00602000 rw-p 00001000 08:01 4097                               /root/tests/blog/test
01a00000-01a21000 rw-p 00000000 00:00 0                                  [heap]
7f235279e000-7f235295e000 r-xp 00000000 08:01 18092481                   /lib/x86_64-linux-gnu/libc-2.23.so
7f235295e000-7f2352b5e000 ---p 001c0000 08:01 18092481                   /lib/x86_64-linux-gnu/libc-2.23.so
7f2352b5e000-7f2352b62000 r--p 001c0000 08:01 18092481                   /lib/x86_64-linux-gnu/libc-2.23.so
7f2352b62000-7f2352b64000 rw-p 001c4000 08:01 18092481                   /lib/x86_64-linux-gnu/libc-2.23.so
7f2352b64000-7f2352b68000 rw-p 00000000 00:00 0
7f2352b68000-7f2352b8e000 r-xp 00000000 08:01 18092453                   /lib/x86_64-linux-gnu/ld-2.23.so
7f2352d72000-7f2352d75000 rw-p 00000000 00:00 0
7f2352d8d000-7f2352d8e000 r--p 00025000 08:01 18092453                   /lib/x86_64-linux-gnu/ld-2.23.so
7f2352d8e000-7f2352d8f000 rw-p 00026000 08:01 18092453                   /lib/x86_64-linux-gnu/ld-2.23.so
7f2352d8f000-7f2352d90000 rw-p 00000000 00:00 0
7ffdaff21000-7ffdaff42000 rw-p 00000000 00:00 0                          [stack]
7ffdaff7e000-7ffdaff81000 r--p 00000000 00:00 0                          [vvar]
7ffdaff81000-7ffdaff83000 r-xp 00000000 00:00 0                          [vdso]
ffffffffff600000-ffffffffff601000 r-xp 00000000 00:00 0                  [vsyscall]
Code injection
Thanks to the sysfs localization of the function address in memory is easy.
Once we will find it we can try to modify running code in the memory.
objdump -S  /proc/25824/exe | grep show_smaller -A 15
  400637:       e8 1b 00 00 00          callq  400657 <show_smaller>
...
  400656:       c3                      retq

0000000000400657 <show_smaller>:
  400657:       55                      push   %rbp
  400658:       48 89 e5                mov    %rsp,%rbp
  40065b:       48 83 ec 20             sub    $0x20,%rsp
  40065f:       89 7d ec                mov    %edi,-0x14(%rbp)
  400662:       8b 45 ec                mov    -0x14(%rbp),%eax
  400665:       89 45 fc                mov    %eax,-0x4(%rbp)
  400668:       eb 18                   jmp    400682 <show_smaller+0x2b>
  40066a:       8b 45 fc                mov    -0x4(%rbp),%eax
  40066d:       89 c6                   mov    %eax,%esi
  40066f:       bf 27 07 40 00          mov    $0x400727,%edi
  400674:       b8 00 00 00 00          mov    $0x0,%eax
  400679:       e8 42 fe ff ff          callq  4004c0 <printf@plt>
  40067e:       83 6d fc 01             subl   $0x1,-0x4(%rbp)
  400682:       83 7d fc 00             cmpl   $0x0,-0x4(%rbp)
  400686:       79 e2                   jns    40066a <show_smaller+0x13>
  400688:       90                      nop
  400689:       c9                      leaveq
  40068a:       c3                      retq
  40068b:       0f 1f 44 00 00          nopl   0x0(%rax,%rax,1)
# dd if=/proc/25824/mem bs=1 skip=$((0x400657)) count=51 2>/dev/null | ndisasm -b 64 -
00000000 55 push rbp
00000001 4889E5 mov rbp,rsp
00000004 4883EC20 sub rsp,byte +0x20
00000008 897DEC mov [rbp-0x14],edi
0000000B 8B45EC mov eax,[rbp-0x14]
0000000E 8945FC mov [rbp-0x4],eax
00000011 EB18 jmp short 0x2b
00000013 8B45FC mov eax,[rbp-0x4]
00000016 89C6 mov esi,eax
00000018 BF27074000 mov edi,0x400727
0000001D B800000000 mov eax,0x0
00000022 E842FEFFFF call qword 0xfffffffffffffe69
00000027 836DFC01 sub dword [rbp-0x4],byte +0x1
0000002B 837DFC00 cmp dword [rbp-0x4],byte +0x0
0000002F 79E2 jns 0x13
00000031 90 nop
00000032 C9 leaveWe will try to change substitution inside the loop to addition. We can do this in two different ways:
- Find proper optcode in the database, and then write a script which will write this value to the memory at given offset
- Recompile example and get instruction code from objdump, then save to file and inject it using dd
The first approach looks a little bit more subtlety but it requires a little bit more knowledge, once the second way looks much more intuitive so let’s try it.
First of all, we need to run our test program in a separate terminal and leave it for the moment. The program will create entry inside /proc folder which we can easily find using ps -e | grep test.
Next step is to change show_smaller function to add. Compile it and find instruction that we want to use.
#include <stdio.h>

void show_smaller(int val)
{
        for (int i=0; i<val; ++i)
                printf( "\n%d", i);

        return;
}
After compilation we can just dump show_smaller using gdb.
(gdb) disas/r show_smaller
Dump of assembler code for function show_smaller:
   0x000000000040065b <+0>:     55      push   %rbp
   0x000000000040065c <+1>:     48 89 e5        mov    %rsp,%rbp
   0x000000000040065f <+4>:     48 83 ec 20     sub    $0x20,%rsp
   0x0000000000400663 <+8>:     89 7d ec        mov    %edi,-0x14(%rbp)
   0x0000000000400666 <+11>:    c7 45 fc 00 00 00 00    movl   $0x0,-0x4(%rbp)
   0x000000000040066d <+18>:    eb 1a   jmp    0x400689 <show_smaller+46>
   0x000000000040066f <+20>:    8b 45 fc        mov    -0x4(%rbp),%eax
   0x0000000000400672 <+23>:    89 c6   mov    %eax,%esi
   0x0000000000400674 <+25>:    48 8d 3d bc 00 00 00    lea    0xbc(%rip),%rdi        # 0x400737
   0x000000000040067b <+32>:    b8 00 00 00 00  mov    $0x0,%eax
   0x0000000000400680 <+37>:    e8 3b fe ff ff  callq  0x4004c0 <printf@plt>
   0x0000000000400685 <+42>:    83 45 fc 01     addl   $0x1,-0x4(%rbp)
   0x0000000000400689 <+46>:    8b 45 fc        mov    -0x4(%rbp),%eax
   0x000000000040068c <+49>:    3b 45 ec        cmp    -0x14(%rbp),%eax
   0x000000000040068f <+52>:    7c de   jl     0x40066f <show_smaller+20>
   0x0000000000400691 <+54>:    90      nop
   0x0000000000400692 <+55>:    c9      leaveq
   0x0000000000400693 <+56>:    c3      retq
End of assembler dump.
(gdb) dump memory func_dump 0x000000000040065b 0x0000000000400693+1
(gdb) quit
dd if=./function_dump bs=1 skip=42 count=4 2>/dev/null | ndisasm -b 64 -
00000000 8345FC01 add dword [rbp-0x4],byte +0x1
dd if=./function_dump bs=1 skip=42 count=4 of=./instruction
4+0 records in
4+0 records out
4 bytes copied, 0.000317381 s, 12.6 kB/s# Now we will patch function in the memory at address 0x40067e we will write 4 bytes to overrite old instruction
# But before lets see memory state before patching:
# dd if=/proc/`ps -e | grep test | awk '{print $1}'`/mem bs=1 skip=$((0x400657)) count=60 2>/dev/null | ndisasm -b 64 -
00000000 55 push rbp
00000001 4889E5 mov rbp,rsp
00000004 4883EC20 sub rsp,byte +0x20
00000008 897DEC mov [rbp-0x14],edi
0000000B 8B45EC mov eax,[rbp-0x14]
0000000E 8945FC mov [rbp-0x4],eax
00000011 EB18 jmp short 0x2b
00000013 8B45FC mov eax,[rbp-0x4]
00000016 89C6 mov esi,eax
00000018 BF27074000 mov edi,0x400727
0000001D B800000000 mov eax,0x0
00000022 E842FEFFFF call qword 0xfffffffffffffe69
00000027 836DFC01 sub dword [rbp-0x4],byte +0x1
0000002B 837DFC00 cmp dword [rbp-0x4],byte +0x0
0000002F 79E2 jns 0x13
00000031 90 nop
00000032 C9 leave
00000033 C3 ret
00000034 0F1F440000 nop dword [rax+rax+0x0]
00000039 4157 push r15
0000003B 41 rex.b
# Now lets perform patching!
dd if=./instruction of=/proc/`ps -e | grep test | awk '{print $1}'`/mem skip=0 bs=1 seek=$((0x40067e))
4+0 records in
4+0 records out
4 bytes copied, 6.8242e-05 s, 58.6 kB/s
# See what has changed?
dd if=/proc/`ps -e | grep test | awk '{print $1}'`/mem bs=1 skip=$((0x400657)) count=60 2>/dev/null | ndisasm -b 64 -
00000000 55 push rbp
00000001 4889E5 mov rbp,rsp
00000004 4883EC20 sub rsp,byte +0x20
00000008 897DEC mov [rbp-0x14],edi
0000000B 8B45EC mov eax,[rbp-0x14]
0000000E 8945FC mov [rbp-0x4],eax
00000011 EB18 jmp short 0x2b
00000013 8B45FC mov eax,[rbp-0x4]
00000016 89C6 mov esi,eax
00000018 BF27074000 mov edi,0x400727
0000001D B800000000 mov eax,0x0
00000022 E842FEFFFF call qword 0xfffffffffffffe69
00000027 8345FC01 add dword [rbp-0x4],byte +0x1
0000002B 837DFC00 cmp dword [rbp-0x4],byte +0x0
0000002F 79E2 jns 0x13
00000031 90 nop
00000032 C9 leave
00000033 C3 ret
00000034 0F1F440000 nop dword [rax+rax+0x0]
00000039 4157 push r15
0000003B 41 rex.bWe replaced 836DFC01 sub dword [rbp-0x4],byte +0x1 with 8345FC01 add dword [rbp-0x4],byte +0x1 so we just changed operand from - to the +.
Now just type 5 and press Enter, if function show_smaller was correctly patched we should be overwhelmed by the numbers in the terminal…
Starting program: /root/tests/bin_analysis/blog/test1
Enter a value :5

6
7
8
....
....
358776628
358776629
358776630
358776631
358776632
# until our patience has come to an end and we will press ctrl+C...
35877663^C
Program received signal SIGINT, Interrupt.
References
Intel optcodes online arch ELF-64 Object File Format Executable and Linkable Format (ELF) How programs get run: ELF binaries Wikipedia ELF: References Linux ELF man pages(5)